How to visualize Symfony logs in dev with Elasticsearch and Kibana
Symfony comes with Monolog and some extension like easy-log-handler that writes logs in a fancier format in var/log/dev.log.
But if you are building a complex application, many API endpoints can be hit at the same time, many workers can run at the same time, … and so, finding something can be very difficult.
To debug in production, we use the ELK stack: Elasticsearch, Logstash, and Kibana. These tools are really powerful and we already wrote about it 🇫🇷.
You may have tried but running Logstash and writing the good configuration is boring. That’s why I contributed to Symfony few months ago an ElasticsearchLogstashHandler.
This handler pushes logs directly to Elasticsearch and format them to something similar to Logstash specification. It dials directly with the HTTP interface of Elasticsearch. This means it will slow down your application if Elasticsearch takes time to answer. Even if all HTTP calls are done asynchronously. So use it only in a dev environment. Actually, it could be possible to use it in a production environment, but you will need to wrap this handler in a handler with buffering capabilities (like the FingersCrossedHandler, or BufferHandler) in order to call Elasticsearch only once with a bulk push. For even better performance and fault tolerance, a proper ELK stack is recommended.
Section intitulée how-to-use-itHow to use it?
Section intitulée 1-enable-the-handler1. Enable the handler:
# config/packages/dev/monolog.yaml
monolog:
    handlers:
        es:
            type: service
            id: Symfony\Bridge\Monolog\Handler\ElasticsearchLogstashHandler
# config/packages/services.yaml
services:
Symfony\Bridge\Monolog\Handler\ElasticsearchLogstashHandler:
autowire: falseSection intitulée 2-run-some-docker-containers2. Run some docker containers:
It’s possible to not use docker, but docker really eases this step. So here we go:
docker network create sf-es-k
docker run -it --rm --name elasticsearch -p 9200:9200 -e "discovery.type=single-node" --network sf-es-k docker.elastic.co/elasticsearch/elasticsearch:7.4.2
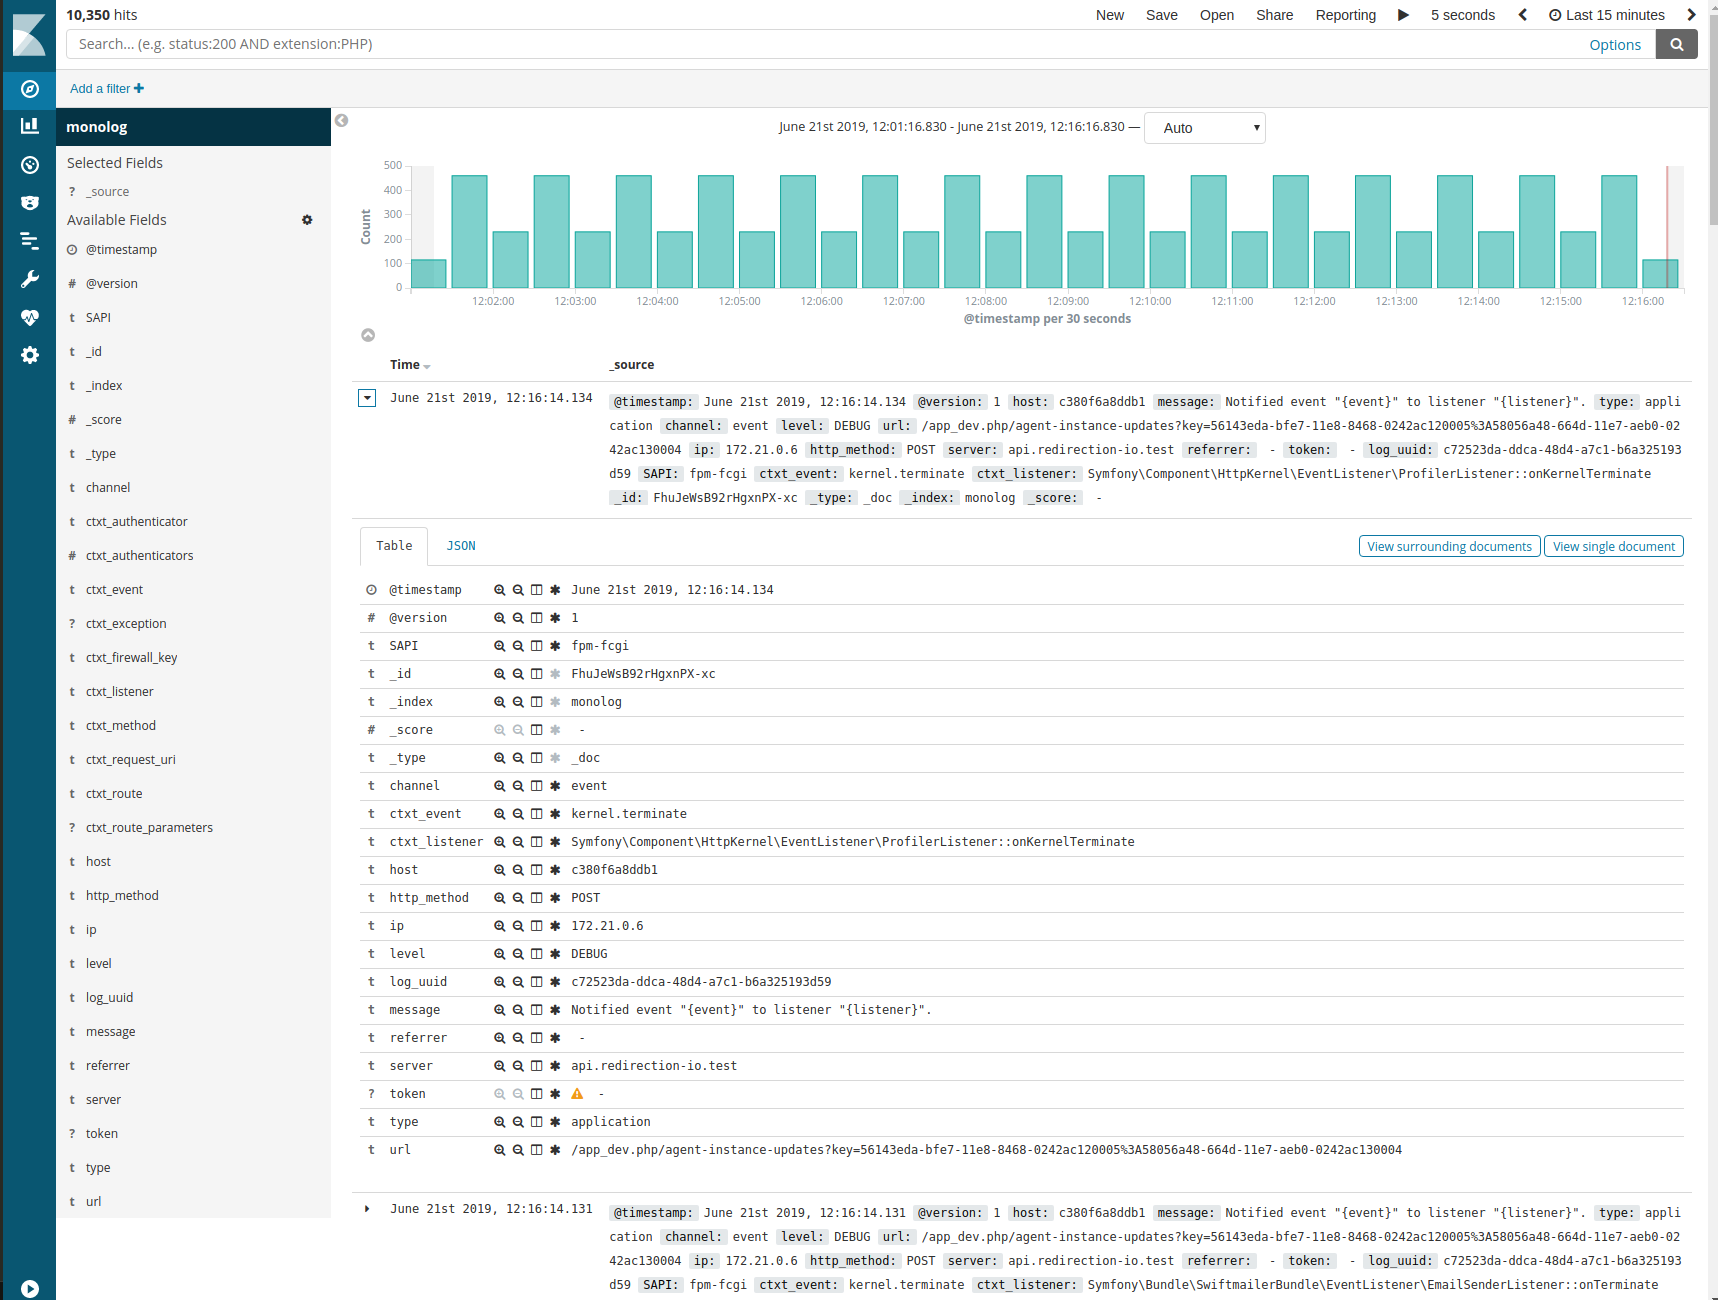
docker run -it --rm -p 5601:5601 --network sf-es-k docker.elastic.co/kibana/kibana:7.4.2Section intitulée 3-profit3. Profit:
- Open http://127.0.0.1:5601/app/kibana#/management/kibana/index_pattern;
- Hit you application at least one time to generate some logs;
- Use
monolog*asindex pattern; - Click on
Next step; - Use
@timestampasTime Filter field name; - Click on
Create index pattern; - Return on the discover view the discover view and 🤩.
Section intitulée 4-bonus4. Bonus:
I also recommend you to enable more processors:
TokenProcessor: Adds information from the current user’s token to the record namely username, roles and whether the user is authenticated;WebProcessor: Overrides data from the request using the data inside Symfony’s request object;RouteProcessor: Adds information about current route (controller, action, route parameters);ConsoleCommandProcessor: Adds information about current console command;UidProcessor: Adds a unique identifier into records.
The last processor UidProcessor is really important to me. It allows to group all logs for only one message (HTTP request or AMQP message). Without that, all logs will be melded together.
Note: If you are using some workers, don’t forget to reset monolog service after each (AMQP) message:
$this->logger->reset();Commentaires et discussions
Nos articles sur le même sujet
Introduction au monitoring d’une application Symfony2
Ce billet n’est pas sponsorisé par Elastic ou NewRelic. Au-delà du développement d’une application Symfony2, notre mission au sein de JoliCode est également de mettre en place les outils qui vont permettre à nos…
par François Dume
Nos formations sur ce sujet
Notre expertise est aussi disponible sous forme de formations professionnelles !
Symfony avancée
Découvrez les fonctionnalités et concepts avancés de Symfony

Elasticsearch
Indexation et recherche avancée, scalable et rapide avec Elasticsearch
Ces clients ont profité de notre expertise
![]()
Nous avons entrepris une refonte complète du site, initialement développé sur Drupal, dans le but de le consolider et de jeter les bases d’un avenir solide en adoptant Symfony. La plateforme est hautement sophistiquée et propose une pléthore de fonctionnalités, telles que la gestion des abonnements avec Stripe et Paypal, une API pour l’application…
![]()
Nous avons accompagné Paris Dauphine dans la conception d’une application Symfony2 permettant la gestion complète de trois masters de l’université. Notre intervention a porté sur la conception de l’application, son architecture, et l’aide au développement, par les équipes de l’Université Paris Dauphine, de l’application.

Refonte complète de la plateforme d’annonces immobilières de Cushman & Wakefield France. Connecté aux outils historiques, cette nouvelle vitrine permet une bien meilleure visibilité SEO et permet la mise en avant d’actifs qui ne pouvaient pas l’être auparavant.